
3D LiDAR Annotation Workflow: Lessons From an Internal Pilot

What the Pilot Set Out to Build
Building a 3D LiDAR annotation workflow requires more than teaching annotators to draw cuboids. Teams need a shared method for interpreting sparse point clouds, checking camera evidence, and reviewing annotations across frames.
An internal Chemin pilot explored these requirements while moving from the KITTI Vision Benchmark Suite to the Waymo Open Dataset. The work established an initial workflow for scene selection, 3D cuboid annotation, sensor alignment, and frame-level review. It also exposed gaps in box fitting, annotator calibration, and multi-camera inspection.
The early-stage pilot identified the quality controls needed before teams increase annotation volume.
Executive Summary
- Moving from KITTI to Waymo exposed workflow gaps in dense scenes and multi-frame tracking.
- Similar box-fitting patterns among annotators showed that the shared guidance needed recalibration before expansion.
- The evaluation separated missed objects from cuboid-fitting and consistency errors. This made each quality issue easier to diagnose.
- The next phase should strengthen class-specific guidance and synchronized camera-LiDAR review before measuring throughput or increasing annotation volume.
Why 3D LiDAR Annotation Quality Is Difficult
A 3D cuboid records an object’s position, dimensions, and orientation. Correct classification doesn’t confirm accurate box geometry.
3D LiDAR annotation quality depends on 4 factors:
- Observed geometry: LiDAR may capture only part of an object because of distance or occlusion, where another object blocks part of the target.
- Inferred boundaries: Annotators still need to estimate surfaces that the sensor doesn’t show clearly.
- Cross-modal evidence: Camera images can clarify object class or orientation, but the views must remain aligned with the point cloud.
- Temporal consistency: Tracking work requires consistent object identities and cuboid fitting across successive frames.
Waymo’s 3D labeling specification asks annotators to fit cuboids closely to visible LiDAR points. When occlusion hides part of an object, annotators must estimate the missing boundary.
Sparse or hidden surfaces require more inference. A vehicle’s visible side may establish its position and heading, while limited roof returns make its height harder to judge.
Figure 1. Cross-view illustration of a 3D vehicle cuboid using camera and LiDAR evidence.
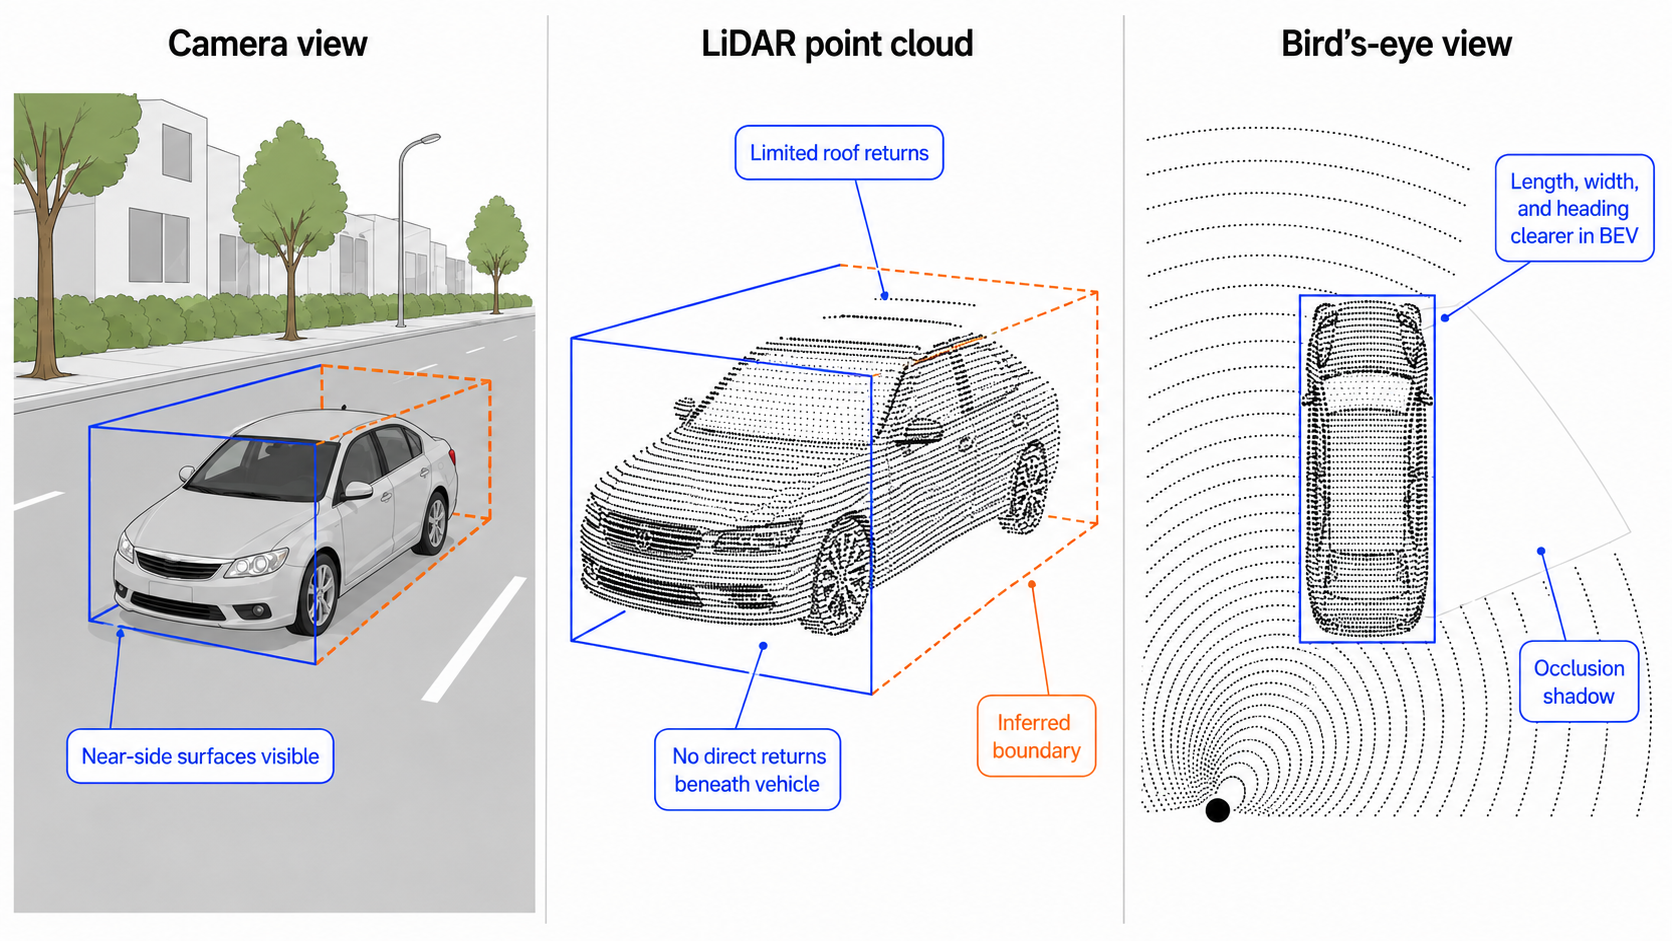
Camera and LiDAR evidence guide cuboid fitting where parts of the vehicle are not directly observed. This diagram is illustrative and does not reproduce pilot data.
Building the Workflow From KITTI to Waymo
KITTI Established the Annotation Baseline
The pilot began with KITTI, where annotators used a forward camera view to interpret LiDAR point clouds and fit 3D cuboids.
The first workflow covered:
- Scene selection: Choose frames that test a defined annotation problem.
- Cross-modal review: Compare camera evidence with LiDAR returns.
- Cuboid fitting: Separate nearby objects and estimate partially hidden boundaries.
- Reference review: Check box position and orientation against benchmark labels.
This gave the team a controlled way to develop the annotation method before introducing tracking and a broader sensor setup.
Waymo Tested the Workflow Across Frames
The pilot then tested the workflow on denser Waymo scenes and consecutive frames. Annotators had to work across synchronized camera and LiDAR data while preserving object identities over time.
The transition added 4 requirements:
- Multi-sensor review: Annotators had to reconcile evidence across a wider sensor view.
- Tracking continuity: Cuboids and object identities had to remain consistent throughout the scene.
- Coverage control: Dense frames increased the risk of missed objects.
- Data handling: Larger files limited the amount of data the pilot could process and evaluate.
How Annotation Errors Were Identified
The workflow included 5 quality checks:
- Scene selection: Use clear frames for calibration and difficult scenes to test the guidelines.
- Cuboid annotation: Label class, geometry, orientation, and tracking identity.
- Coordinate alignment: Apply ego-motion correction to account for the sensor vehicle’s movement before comparing annotations with reference boxes.
- Metric review: Measure each annotation against the relevant quality check.
- Visual inspection: Use bird’s-eye-view overlays to locate unmatched boxes and recurring spatial errors.
The evaluation showed whether each issue came from object coverage, box fitting, or annotator consistency.
Figure 2. Five-stage 3D LiDAR annotation workflow
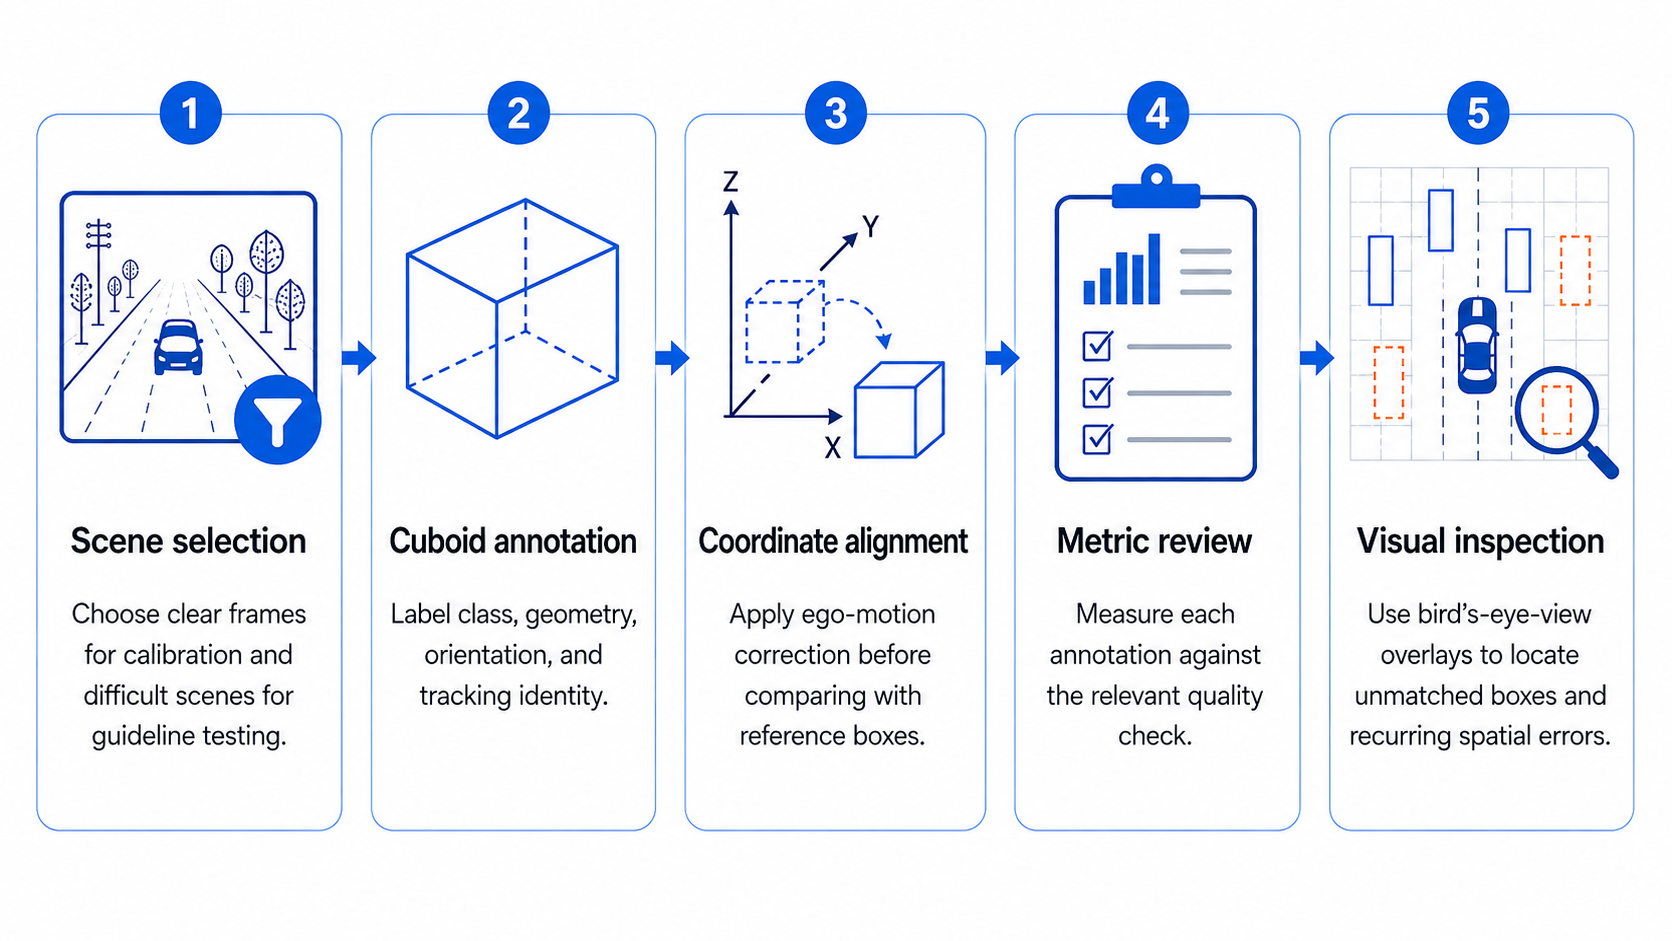
The sequence supports diagnosing whether an error stems from object coverage, cuboid fit, or annotator consistency. This diagram is illustrative and does not reproduce pilot data.
Similar Box-Fitting Decisions Revealed a Shared Calibration Gap
The evaluation compared the pilot annotations with Waymo reference labels. It also compared how different annotators labeled the same frames.
The annotators made similar box-fitting decisions, which suggested the team had learned an approach that didn’t fully align with the benchmark annotations.
The finding changed the calibration process:
- Shared gold frames: Use the same reviewed examples across the team.
- Correction notes: Explain how each cuboid should fit the visible evidence.
- Calibration review: Check the examples against the intended labeling standard.
- Repeat evaluation: Rerun the same assessment before increasing annotation volume.
Inter-annotator agreement (IAA) shows whether annotators make consistent box-fitting decisions on the same frames. Comparison against Waymo reference labels shows whether those decisions match the benchmark annotations. A team can agree internally while still interpreting the labeling guidance differently from the reference.
Cuboid Height and Class-Specific Fit Needed Separate Rules
The evaluation found recurring errors in cuboid height and vertical position.
LiDAR may capture only a few points on the roof and no points beneath the vehicle. Annotators must estimate where the top and bottom of the cuboid should sit.
A cuboid can align with the vehicle from above while still having the wrong height or vertical position.
Figure 3. Vertical fit errors in a 3D cuboid.
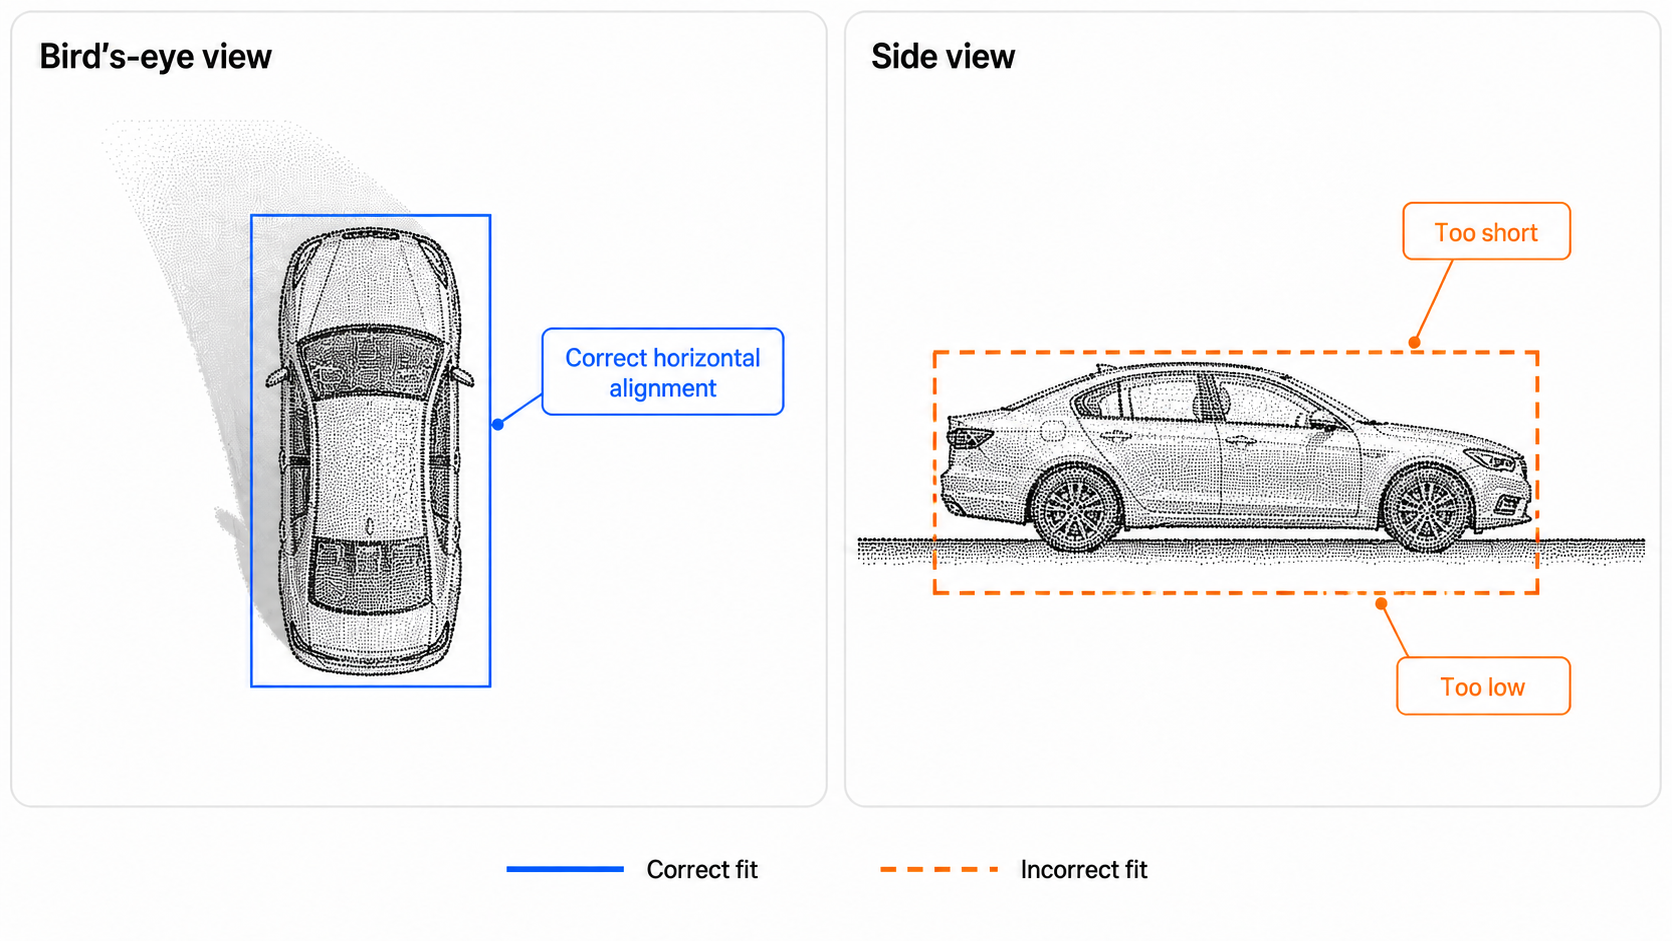
Bird’s-eye-view overlays confirm horizontal placement but do not verify height or vertical position. This diagram is illustrative and does not reproduce pilot data.
Intersection over Union, or IoU, measures how much an annotated box overlaps with a reference box.
- Bird’s-eye-view IoU: Measures horizontal overlap and ignores height.
- 3D IoU: Measures overlap across the full cuboid, including height and vertical position.
The review separated cuboid quality into 4 checks:
- Object coverage: Was the object found and labeled?
- Horizontal fit: Does the bird’s-eye-view footprint align with the reference?
- Vertical fit: Does the full cuboid have the correct height and Z-position?
- Orientation: Does the box follow the object’s heading?
Comparing both measures showed whether the error came from horizontal placement or vertical fit.
Pedestrian boxes exposed a separate calibration problem. Some were fitted too tightly. The next guideline set should include reviewed examples for each class, with clear rules for the extent of vehicle and pedestrian boxes.
Metrics Connected Each Error to a Cause
The pilot used different metrics for different annotation problems:
- Precision and recall: Were reference objects missed or unsupported boxes added?
- Bird’s-eye-view and 3D IoU: How closely did each cuboid fit the reference geometry?
- Tracking analysis: Did object identity remain consistent across frames?
- IAA: Did annotators make similar box-fitting decisions on the same frames?
Frame-level overlays then showed where each error appeared. This helped reviewers separate missed coverage from poor cuboid fit or tracking breaks.
Matching thresholds also affect the result because they determine which cuboid pairs count as valid matches. Teams should document the threshold and keep it consistent across calibration rounds.
What the Pilot Revealed in Difficult Scenes
Camera Evidence Helped Separate Tightly Parked Vehicles
A dense KITTI street scene gave the pilot an early sensor-fusion test. Parked vehicles sat close together, partially blocking one another. Since the vehicles weren’t moving, annotators couldn’t use motion to confirm their heading.
Figure 4. Cuboid separation for tightly parked vehicles.

Point clusters run together when vehicles park close together, so camera evidence confirms the vehicle count and heading before boxes are drawn. This diagram is illustrative and does not reproduce KITTI data.
The workflow followed a fixed order:
- Camera review: Confirm the number of vehicles and their approximate orientation.
- Point-cloud review: Identify the visible returns for each vehicle.
- Cuboid fitting: Draw separate boxes where adjacent point clusters appeared to overlap.
A defined review order helps annotators separate overlapping vehicles and apply the same boundary rules.
Dense Waymo Frames Exposed Missed Objects
Frame-level review showed that object coverage became less consistent as scenes grew denser. Distant objects were easier to miss than vehicles near the sensor.
Figure 5. Distance-related coverage gaps in a dense frame.

Sparse returns at range give annotators less to work with, so distant objects go unlabeled more often than near ones. This diagram is illustrative and does not reproduce pilot data.
The finding changed the review sequence:
- Check whether all relevant objects are labeled.
- Inspect the fit of each cuboid.
- Review object identity across the sequence.
A well-fitted cuboid doesn’t offset a missed object elsewhere in the frame.
Task design should account for scene density as well as sequence length. Dense segments may need shorter assignments or a separate coverage review.
Bird’s-Eye-View Review Couldn’t Verify Cuboid Height
The evaluation found recurring differences in cuboid height and vertical position. Bird’s-eye-view overlays showed horizontal placement, but they couldn’t show whether a box sat too low or ended too early.
The assessment platform also lacked synchronized point-cloud and multi-camera inspection.
The next platform needs to:
- Project 3D cuboids onto synchronized camera views.
- Preserve calibration data during export and evaluation.
- Support frame-level review while preserving object identities.
The pilot turned a recurring annotation error into a clear tooling requirement. Reviewers need camera images and LiDAR point clouds to assess vertical fit.
Why Calibration Had to Come Before Expansion
3D LiDAR annotation depends on shared decisions about box extent, orientation, and hidden boundaries. Those decisions are harder to assess when every annotator follows the same box-fitting approach.
The evaluation used 2 comparison methods:
- Against Waymo reference labels: Measures how closely the annotated cuboids match the target geometry and labeling standard.
- Across annotators working on the same frames: Measures whether annotators make similar box-fitting decisions on identical data.
The comparison assessed whether annotators followed the same approach and whether that approach aligned with the reference standard.
Similar boxes across annotators didn’t automatically mean the boxes matched the reference standard. Expanding the dataset before calibration would carry the same fitting pattern into more frames.
Before expanding the dataset, the team should review the shared box-fitting approach against the intended labeling standard and test the revised guidance on the same frames.
Evaluation Criteria for a 3D LiDAR Pilot
- Quality evidence: Review metric definitions and frame-level examples. A single accuracy figure doesn’t indicate whether errors stemmed from missed objects or from the cuboid fit.
- Platform fit: Use a tool that preserves calibration data and supports synchronized camera-LiDAR review. Reviewers should be able to inspect vertical fit and tracking continuity.
- Class-specific calibration: Include reviewed gold examples for each object class. Vehicle box rules don’t define the extent of the pedestrian boxes.
- Pilot scope: Use a small pilot to identify workflow and tooling gaps. Assess throughput and sustained quality through a broader evaluation.
How to Build a 3D LiDAR Annotation Pilot
- Define the labeling policy: Document box tightness, inferred boundaries, and class-specific rules.
- Select scenes by failure mode: Use clear frames for onboarding, then add scenes that test one known source of uncertainty.
- Calibrate on shared gold frames: Ask annotators to label the same examples and review corrections against the written policy.
- Build evaluation into the workflow: Align coordinates before comparison. Use metrics and frame-level review to separate coverage, geometry, and consistency errors.
- Expand after recalibration: Rerun the same evaluation after expert review. Measure throughput only after the revised guidance produces stable results.
A Clearer Path to 3D LiDAR Quality
The pilot built an initial 3D LiDAR annotation workflow and identified controls needed before the annotation volume increases.
Teams need clear cuboid-fitting rules and a review process that assesses camera and LiDAR evidence together. Retesting the same Waymo frames shows whether revised guidance improves box fitting.
Chemin can help teams define the annotation rules and evaluation method for an early LiDAR pilot. This helps identify coverage and geometry errors before expansion.
Can your LiDAR workflow catch its own errors?
Discover more

GPT-4o-mini vs SEA-LIONv3: Bahasa Indonesia LLM Evaluation
A 50-task study tested Indonesian-specific prompts in English and Bahasa Indonesia to examine how model preferences varied across local-context tasks.
What Is Data Labeling? A Comprehensive Guide
Without properly labeled data, ML models struggle to understand key features, leading to unreliable results. This guide explores what data labeling is, how it works, different approaches, best practices, and its real-world applications.

SEA-LIONv3 vs SahabatAI-v1: Bahasa Indonesia LLM Evaluation
SEA-LIONv3 and SahabatAI-v1 were tested on 50 Indonesian-specific tasks to examine how model preferences changed across task categories and prompt languages.